View Seth’s Arizona Report for an overview of what occurred in the state.
The following 40min video is Seth’s presentation of his analysis of Pima County and some wider issues in Arizona, Dec 14, 2021:
See here for the slides from the above presentation. 1
The following heat map shows which precincts within Pima County appear to have the highest number of anomalies:
Source: Telegram Post, Nov 7, 2021
Top Ten Precincts to Canvass
| 90 | (Crimson Category) |
| 127 | (Crimson Category) |
| 150 | (Republican Category) |
| 131 | (Republican Category) |
| 142 | (Republican Category) |
| 88 | (Competitive Category) |
| 125 | (Competitive Category) |
| 107 | (Democrat Category) |
| 55 | (Democrat Category) |
| 100 | (Democrat Category) |
Top Ten Crimson Precincts For Canvass
A “Crimson Precinct” is one won by Romney, and won by Trump by a bigger margin in 2016. Per corresponding registrations in other areas, we would expect precincts to be more Republican in 2020.
| RED (HIGH) | 90 | (11.9% margin loss for Trump) |
|---|---|---|
| 127 | (11.8% margin loss for Trump with 16.2% Trump vote increase) | |
| 109 | ||
| 168 | ||
| 39 | ||
| 147 | ||
| 185 | ||
| YELLOW (MODERATE) | 83 | |
| 277 | ||
| 1335 |
Top Ten Republican Precincts For Canvass
A “Republican Precinct” is one won by Romney, and won by Trump in 2016, but with a smaller margin of victory. Per corresponding registrations, some precincts are likely to become more Republican, while others are likely to continue to trend left.
| RED (HIGH) | 150 | (16.2% margin loss for Trump, precinct flipped) |
|---|---|---|
| 131 | (14.5%, flipped) | |
| 142 | (12.4%, flipped) | |
| 217 | (11.9%, flipped) | |
| 130 | (11.5%, flipped) | |
| 114 | (11.4%, flipped) | |
| 104 | (11.4%, flipped) | |
| 95 | (10.9%) | |
| 205 | (10.9%) | |
| 141 | (10.7%, flipped) |
Data Table
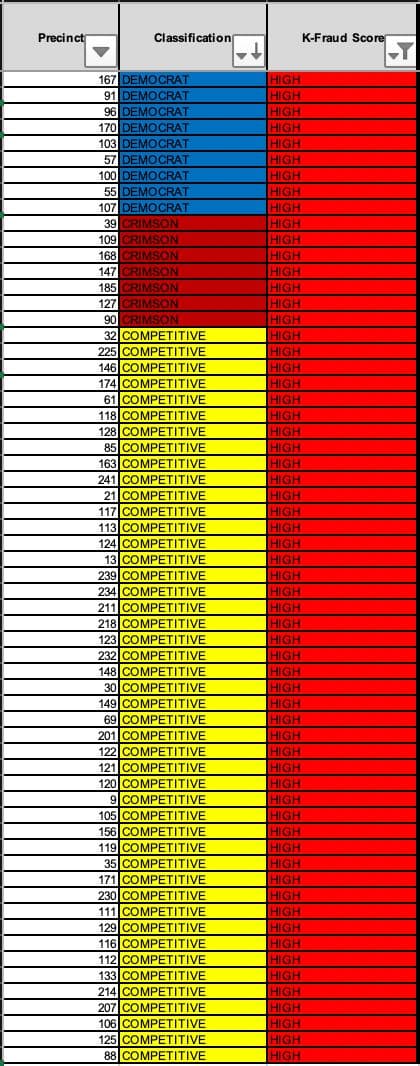
To accompany the Pima County Canvassing Map, here are the precincts that rate as “high” for statistical evidence of fraud.

Classification refers to the voting behavior of the precinct (trend) since 2012, when there was the RINO to MAGA shift within the GOP.
| Trump Trend | Dem precinct that is trending toward Trump |
| Republican | Romney and Trump 2016 won Precinct, but Trump won by less. Possible to trend in either direction. |
| Democrat | Democrat typically receives 65% plus in precinct. |
| Competitive | Democrat under 65% and GOP over 35% with room for fluctuation. |
| Crimson | Won by Romney and Won by Trump 2016, with greater margin than 2012. Almost all counties in America with this behavior are becoming more Republican in registration. Should be more favorable to Trump in 2020. |
Source: Telegram Post, Nov 8, 2021
Footnotes & References
-
Source: Telegram Post, Dec 14, 2021 ↩